- 浏览: 963787 次
-

文章分类
最新评论
-
liberty1789:
楼主好文章
java的内存管理 -
yanzhexian:
真长 mark之!
java的内存管理 -
zhaoyp:
不错的文章,谢谢分享。
java的内存管理 -
eclipse-my:
学习了,谢谢
java的内存管理 -
luohuayuan69:
我把代码复制了一下 为什么应用中代码TestPopUpMana ...
flex4 中创建自定义弹出窗口
Oracle indexclustering factor 索引聚簇因子
聚簇因子
我们往往会讨论什么时候用索引,什么时候用全表:大家可能说的最多的是需要的数据量和表里面的数据量占比,有些人说20%以下用索引,有些人说10%以上就不能用索引了,
其实除了和数据量有关还有一个非常关键因数就是聚簇因子。
什么是聚簇因子?
我们先看我们的常用的表又叫堆表。堆表的最大特征就是数据的存储独立性,即数据的存储与数据值没有任何关联地被存储在磁盘的任意位置上。从另外一个侧面来看,该特征也就意味着为了查询我们所需要的数据必然要在磁盘的多个位置上进行查找。
所谓"任意位置"的深层含义是指能够把数据物理地存储在磁盘上的方法多种多样。然而,从另外一个角度来看,随机存储方式就是数据所占据的位置分散在不同的数据块上。
在这种存储状态下,查询相同数据所执行的物理读取数量会随着查询数据的分散程度而不同。例如,数据行1~10被分散存储在10个数据块与两个数据块相比较,虽然两种情况逻辑读取的数据行数(都是10行)是相同的,但在物理(I/O)读取的数据块数上却相差5倍。在关系型数据库中,不论在何种情况下,每次最少都需要读取一个数据块。尽管我们每次要求读取的是行,但是实际上每次读取的却是数据块。因此,如果能够在内存中命中我们所需要查询的数据行,则在很大程度上就能够减少物理I/O的数量。尽管在不同系统环境下会略有一些差异,但在一般情况下,从内存块上查询数据的速度比从磁盘块上查询数据的速度至少快30倍左右(有些可能数百倍),聚簇因子主要影响着索引的读取。
聚簇因子是指,按照索引列值进行了排序的索引行序和对应表中数据行序的相似程度。这就好似把孩子与父母的相像程度用数值来表示一样。由于聚簇因子大小对数据读取效率有着直接的影响。假设数据存储如下图:
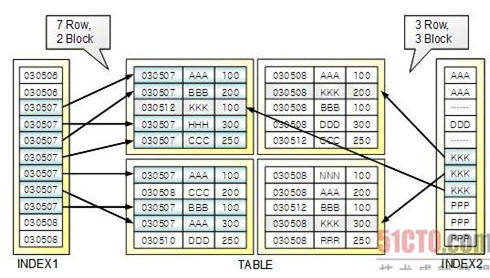
则index1访问其中7行,需要2个块,而index2访问3行就需要3个块,
可见index2的 聚簇因子是很不好的,我们假想下:加入有一个表t有1000万行,有10万个块,我们有个provcode(省)是索引,provcode的distinct有32个,那么如果我们取其中的一个省份如果按照平均来计算是不是就是1/32的数据,这个比例接近3%,很多人认为这个应该走provode索引,但是如果这个32个值是平均分布,也就是说很可能导致我们取其中一个省份,由于他分布在所有的数据块里面,导致我们相当于要读取整个表,这个性能是非常差的,这个时候全表就效果更好(这里有多块读等因数)。改变聚簇因子的办法不是建立什么索引,而是改变数据的存储方式,如果一个表的数据已经固定了,我们怎么去使他相对某一列的聚簇因子好呢,我们可以在插入的时候将数据进行那一列的order by ,这样会使得数据是按照顺序的插入。好的聚簇因子的例子:

上图可以看到clustering_factor和块数是相等的,这个是最好情况,最坏的情况是clustering_factor等于num_rows。
对于究竟应当按照哪个列的顺序存储数据,这个也需要和业务相关,有些我们是控制不了的,但是我们需要理解存储顺序对我们读取的影响,如果我们想获得好的聚簇因子只需要定期对表进行CTAS(create table … as … order by )即可,不过表重构的代价也是不小的,而且表的重构操作也不是随心所欲的事情,所以我们需要理解聚簇因子并很好的使用它。
一. 官网说明
The indexclustering factor measures row order in relation to an indexed value suchas employee last name. The more order that exists in rowstorage for this value, the lower the clustering factor.
-- row 存储的越有序,clustering factor 的值越低
Theclustering factor is useful as a rough measure of thenumber of I/Os required to read an entire table by means of an index:
(1)If the clustering factor is high, then Oracle Database performs a relatively high number of I/Os during a large index range scan. The index entries point to random table blocks, so the database may have to read and reread the same blocks over and over again to retrieve the data pointed to by the index.
--当clustering factor 很高时,说明index entry(rowid) 是随机指向一些block的,在一个大的indexrange scan时,这样为了读取这些rowid 指向的block,就需要一次有一次重复的去读这些block。
(2)If the clustering factor is low, then Oracle Database performs a relativelyl ow number of I/Os during a large index range scan. The index keys in arange tend to point to the same data block, so the database does not have to read and reread the same blocks over and over.
--当clustering factor 值低时,说明index keys(rowid) 是指向的记录是存储在相同的block里,这样去读row时,只需要在同一个block里读取就可以了。就可以减少重复读取block的次数。
The clustering factor is relevant for index scans because it can show:
(1)Whether the database will use an index for large range scans
(2)The degree of table organization in relation to the index key
(3)Whether you should consider using an index-organized table,partitioning, or table cluster if rows must be ordered by the index key
http://download.oracle.com/docs/cd/E11882_01/server.112/e16508/indexiot.htm#CNCPT89180
二. Index Clustering Factor说明
在里面没有提到index Clustering Factor参数,所以这里说明一下。
简单的说, IndexClustering Factor是通过一个索引扫描一张表,需要访问的表的数据块的数量,即对I/O的影响. 也代表索引键值存储位置是否有序。
(1)如果越有序,即相邻的键值存储在相同的block,那么这时候ClusteringFactor 的值就越低。
(2)如果不是很有序,即键值是随即的存储在block上,这样在读取键值时,可能就需要一次又一次的去访问相同的block,从而增加了I/O.
Clustering Factor 的计算方式如下:
(1)扫描一个索引(large index range scan)
(2)比较某行的rowid和前一行的rowid,如果这两个rowid不属于同一个数据块,那么cluster factor增加1
(3)整个索引扫描完毕后,就得到了该索引的cluster factor。
如果ClusteringFactor接近于表存储的块数,说明这张表是按照索引字段的顺序存储的。
如果ClusteringFactor接近于行的数量,那说明这张表不是按索引字段顺序存储的。
在计算索引访问成本的时候,这个值十分有用。Clustering Factor乘以选择性参数(selectivity )就是访问索引的开销。
如果这个统计数据不能真实反映出索引的真实情况,那么可能会造成优化器错误的选择执行计划。另外如果某张表上的大多数访问是按照某个索引做索引扫描,那么将该表的数据按照索引字段的顺序重新组织,可以提高该表的访问性能。
三. 测试
3.1 模拟问题
--查看版本信息
SYS@anqing2(rac2)> select * fromv$version where rownum=1;
BANNER
----------------------------------------------------------------
Oracle Database 10g Enterprise EditionRelease 10.2.0.4.0 - Prod
--创建测试表
SYS@anqing2(rac2)> create table t as select * from dba_objects where 1=2;
Table created.
SYS@anqing2(rac2)> begin
2 for i in 1..10 loop
3 insert /*+append*/ into t select * from dba_objects order by i;
4 commit;
5 end loop;
6 end;
7 /
PL/SQL procedure successfully completed.
-- 这样insert的原因是保证数据存储的无序性
SYS@anqing2(rac2)> select count(*) fromt;
COUNT(*)
----------
502720
--查看表的大小
SYS@anqing2(rac2)> set wrap off
SYS@anqing2(rac2)> col owner for a10
SYS@anqing2(rac2)> col segment_name fora15
SYS@anqing2(rac2)> select owner, segment_name, blocks, extents,bytes/1024/1024||'M' "size" from dba_segments where owner='SYS' and segment_name='T';
OWNERSEGMENT_NAME BLOCKS EXTENTS size
---------- --------------- -------------------- -------------------------------
SYS T 6912 69 54M
--在object_id上构建索引
SYS@anqing2(rac2)> create index idx_t_id on t(object_id);
Index created.
SYS@anqing2(rac2)> select owner, segment_name, segment_type,blocks, extents,bytes/1024/1024||'M' "SIZE" from dba_segments where owner='SYS' and segment_name=upper('idx_t_id');
ownersegment_name segment_type blocksextents size
---------- --------------------------------- ---------- ---------- ------------
SYS IDX_T_ID INDEX 1152 24 9M
--在没有收集相关的统计信息之前,我们查看一下Index Clustering Factor
SYS@anqing2(rac2)> select owner,index_name, clustering_factor, num_rows from dba_indexes where owner='SYS' andindex_name='IDX_T_ID';
OWNERINDEX_NAMECLUSTERING_FACTOR NUM_ROWS
---------- ----------------------------------------------- ----------
SYSIDX_T_ID 502720 502720
--收集统计信息
SYS@anqing2(rac2)> exec dbms_stats.gather_table_stats('SYS','T',cascade => true);
PL/SQL procedure successfully completed.
--再次查看InexClustering Factor
SYS@anqing2(rac2)> select owner, index_name,clustering_factor, num_rows from dba_indexes where owner='SYS' and index_name='IDX_T_ID';
OWNERINDEX_NAMECLUSTERING_FACTOR NUM_ROWS
---------- ----------------------------------------------- ----------
SYSIDX_T_ID 502720 502720
--统计信息收集前和后,Clustering Factor 值不变,说在创建索引的时候,会收集表中中数据真正的行数。并且这里的Clustering Factor 等于Num_rows,也也说明表的Clustering Factor 是无序的。
--查看一个确定值,然后查看执行计划
SYS@anqing2(rac2)> explain plan for select *from t where object_id=1501;
Explained.
SYS@anqing1(rac1)> select * fromtable(dbms_xplan.display);
PLAN_TABLE_OUTPUT
-------------------------------------------------------------------------------------------------------
Plan hash value: 514881935
----------------------------------------------------------------------------------------
| id| operation| name | rows| bytes | cost (%cpu)| time |
----------------------------------------------------------------------------------------
| 0| select statement | |10 | 930 | 14(0)| 00:00:01 |
| 1| table accessby index rowid| t | 10 |930 | 14(0)| 00:00:01 |
|* 2| index range scan | idx_t_id | 10 || 3 (0)| 00:00:01 |
----------------------------------------------------------------------------------------
Predicate Information (identified byoperation id):
PLAN_TABLE_OUTPUT
-------------------------------------------------------------------------------------------------------
2- access("OBJECT_ID"=1000)
--这里走了索引,cost为14
--查询一个范围的执行计划
SYS@anqing1(rac1)> explain plan for select * from t where object_id>1000 and object_id<2000;
Explained.
SYS@anqing1(rac1)> select * fromtable(dbms_xplan.display);
PLAN_TABLE_OUTPUT
----------------------------------------------------------------------------------------------------
Plan hash value: 1601196873
--------------------------------------------------------------------------
| Id| Operation | Name |Rows | Bytes | Cost(%CPU)| Time |
--------------------------------------------------------------------------
| 0| SELECT STATEMENT | |8884 | 806K| 1537(2)| 00:00:19 |
|* 1| TABLE ACCESSFULL| T | 8884 |806K| 1537 (2)| 00:00:19 |
--------------------------------------------------------------------------
Predicate Information (identified byoperation id):
---------------------------------------------------
PLAN_TABLE_OUTPUT
----------------------------------------------------------------------------------------------------
1- filter("OBJECT_ID"<2000 AND "OBJECT_ID">1000)
13 rows selected.
--注意,object_id上是否索引的,但这里并没有使用索引而是使用了全表扫描
--刷新buffercache,然后查看SQL 执行的物理读,这个是否全表扫描的
SYS@anqing1(rac1)> alter system flush buffer_cache;
System altered.
Elapsed: 00:00:00.24
SYS@anqing1(rac1)> set autot traceonlystat
SYS@anqing1(rac1)> select * from t where object_id>1000 and object_id<2000;
9990 rows selected.
Elapsed: 00:00:17.13-- 用了17秒
Statistics
----------------------------------------------------------
1 recursive calls
0 db block gets
7573 consistent gets
6911 physical reads--物理读
984 redo size
746085 bytes sent via SQL*Net toclient
7715 bytes received via SQL*Netfrom client
667 SQL*Net roundtrips to/fromclient
0 sorts (memory)
0 sorts (disk)
9990 rows processed
--强制走索引,看执行计划
SYS@anqing1(rac1)> set autot off
SYS@anqing1(rac1)> explain plan for select /*+ index(t idx_t_id) */ * from t where object_id>1000 and object_id<2000;
Explained.
Elapsed: 00:00:00.03
SYS@anqing1(rac1)> select * from table(dbms_xplan.display);
PLAN_TABLE_OUTPUT
----------------------------------------------------------------------------------------------------
Plan hash value: 514881935
----------------------------------------------------------------------------------------
| Id| Operation |Name | Rows | Bytes | Cost (%CPU)| Time |
----------------------------------------------------------------------------------------
| 0| SELECT STATEMENT | |8884 | 806K| 8974(1)| 00:01:48 |
| 1| TABLE ACCESSBY INDEX ROWID| T | 8884 |806K| 8974 (1)| 00:01:48 |
|* 2| INDEX RANGE SCAN | IDX_T_ID | 8942 || 22 (0)| 00:00:01 |
----------------------------------------------------------------------------------------
Predicate Information (identified byoperation id):
PLAN_TABLE_OUTPUT
----------------------------------------------------------------------------------------------------
2- access("OBJECT_ID">1000 AND "OBJECT_ID"<2000)
14 rows selected.
--强制走索引之后,这里的使用了index range scan,但是里的cost 变成了8974.而走全表扫描时,是1537.
--查看强制走索引的物理读
SYS@anqing1(rac1)> alter system flushbuffer_cache;
System altered.
Elapsed: 00:00:00.13
SYS@anqing1(rac1)> select /*+ index(tidx_t_id) */ * from t where object_id>1000 and object_id<2000;
9990 rows selected.
Elapsed: 00:00:00.25
Statistics
----------------------------------------------------------
0 recursive calls
0 db block gets
10679 consistent gets
154 physical reads
0redo size
205626 bytes sent via SQL*Net toclient
7715 bytes received via SQL*Netfrom client
667 SQL*Net roundtrips to/fromclient
0 sorts (memory)
0 sorts (disk)
9990 rows processed
--这里的物理读要比走索引低很多,但是Oracle 却没有使用索引。因为Oracle 认为走索引的Cost 比 走全表扫描大。而是是大N倍。 而CBO 就是基于Cost 来决定执行计划的。
通过第二节里的分析,对于索引的Cost,Oracle 是根据Clustering Factor参数来计算的,而我们的数据Clustering Factor参数很高,数据存储无序。 这就造成了Oracle 认为走索引的cost 比全表扫描大。
3.2 解决问题
通过上面的分析,可以看出,要降低Clustering Factor才能解决问题,而要解决Clustering Factor,就需要重新对table表的存储位置进行排序。
--重建table
SYS@anqing1(rac1)> create table tt as select * from t where 1=0;
Table created.
SYS@anqing1(rac1)> insert /*+append */ into tt select * from t order by object_id;
502720 rows created.
SYS@anqing1(rac1)> commit;
Commit complete.
SYS@anqing1(rac1)> truncate table t;
Table truncated.
SYS@anqing1(rac1)> insert /*+append */ into t select * from tt;
502720 rows created.
SYS@anqing1(rac1)> commit;
Commit complete.
--查看表和索引的信息
SYS@anqing1(rac1)> select owner,segment_name, blocks, extents, bytes/1024/1024||'M' "size" fromdba_segments where owner='SYS' and segment_name='T';
OWNERSEGMENT_NAME BLOCKS EXTENTS size
---------- --------------- -------------------- -------------------------------
SYS T 6912 69 54M
SYS@anqing1(rac1)> select owner,segment_name, segment_type,blocks, extents, bytes/1024/1024||'M'"SIZE" from dba_segments where owner='SYS' andsegment_name=upper('idx_t_id');
OWNERSEGMENT_NAME SEGMENT_TYPEBLOCKS EXTENTS SIZE
---------- --------------------------------- ---------- ---------- ------------
SYSIDX_T_ID INDEX 102423 8M
SYS@anqing1(rac1)> select owner,index_name, clustering_factor, num_rows from dba_indexes where owner='SYS' andindex_name='IDX_T_ID';
OWNERINDEX_NAMECLUSTERING_FACTOR NUM_ROWS
---------- ----------------------------------------------- ----------
SYSIDX_T_ID 502720 502720
--对索引进行rebuild
SYS@anqing1(rac1)> alter index idx_t_id rebuild;
Index altered.
--查看ClusteringFactor
SYS@anqing1(rac1)> select owner, index_name, clustering_factor,num_rows from dba_indexes where owner='SYS' and index_name='IDX_T_ID';
OWNERINDEX_NAME CLUSTERING_FACTOR NUM_ROWS
---------- ----------------------------------------------- ----------
SYSIDX_T_ID 6958 502720
--注意这里的Factor,已经变成6958.我们收集一下表的统计信息,然后与表的block 进行一次比较。
SYS@anqing1(rac1)> exec dbms_stats.gather_table_stats('SYS','T',cascade => true);
PL/SQL procedure successfully completed.
SYS@anqing1(rac1)> select blocks from dba_tables where table_name='T';
BLOCKS
----------
6896
--表T 实际使用的block是6896,Clustering Facter 是6958.基本还是比较接近了。这也说明相邻的row是存储在相同的block里。
--再次查看之前sql的执行计划
SYS@anqing1(rac1)> set linesize 100
SYS@anqing1(rac1)> explain plan for select * from t where object_id>1000 and object_id<2000;
Explained.
SYS@anqing1(rac1)> select * from table(dbms_xplan.display);
PLAN_TABLE_OUTPUT
----------------------------------------------------------------------------------------------------
Plan hash value: 514881935
----------------------------------------------------------------------------------------
| Id| Operation |Name | Rows | Bytes | Cost (%CPU)| Time |
----------------------------------------------------------------------------------------
| 0| SELECT STATEMENT | |8928 | 810K| 147(1)| 00:00:02 |
| 1| TABLE ACCESSBY INDEX ROWID| T | 8928 |810K| 147 (1)| 00:00:02 |
|* 2| INDEX RANGE SCAN | IDX_T_ID | 8944 || 22 (0)| 00:00:01 |
----------------------------------------------------------------------------------------
Predicate Information (identified by operationid):
PLAN_TABLE_OUTPUT
----------------------------------------------------------------------------------------------------
2- access("OBJECT_ID">1000 AND "OBJECT_ID"<2000)
14 rows selected.
--注意这里的cost已经将到了147. 性能提升还是非常明显。
SYS@anqing1(rac1)> set autot trace stat
SYS@anqing1(rac1)> set timing on
SYS@anqing1(rac1)> alter system flush buffer_cache;
System altered.
Elapsed: 00:00:00.08
SYS@anqing1(rac1)> select * from t whereobject_id>1000 and object_id<2000;
9990 rows selected.
Elapsed: 00:00:00.25
Statistics
----------------------------------------------------------
1 recursive calls
0 db block gets
1473 consistent gets
147 physical reads
0 redo size
205626 bytes sent via SQL*Net toclient
7715 bytes received via SQL*Netfrom client
667 SQL*Net roundtrips to/fromclient
0 sorts (memory)
0 sorts (disk)
9990 rows processed
四. 小结
通过以上说明和测试,可以看到Clustering Factor 也是索引健康的一个重要判断的标准。 其值越低越好。 它会影响CBO 选择正确的执行计划。但是要注意一点,Clustering Factor 总是趋势与不断恶化的。
提到了一个索引的选择性. 索引的选择性是指索引列中不同值的数目与表中记录数的比。如果一个表中有2000条记录,表索引列有1980个不同的值,那么这个索引的选择性就是1980/2000=0.99。一个索引的选择性越接近于1,这个索引的效率就越高。CBO的优化器一般不会使用选择性不好的索引。
现在举一个例子来看下为什么索引的选择性越高效率越高。一般索引里会包含rowid和键值。 假设在字段name 上有索引,其值如下:
row1 dave
row2 dave
row3 dave
row4 dave
row5 anqing
按以上6条记录看,索引的选择性=2/6=0.33. 在这种情况下,如果我们根据Dave 来查询,那么索引就返回5行rowid。如果是多表的netsed loop连接,那代价就会很大了。所以当索引的选择性越低,这种扫描的代价越大。
对于这种列,可以说是数据倾斜。 对这种情况,就需要收集列信息的直方图(histogram)。让CBO 在选择执行计划时得到更多的信息,从而选择正确的执行计划。


发表评论

相关推荐
Oracle中聚簇表的使用,详细的介绍了oracle中聚簇表的创建及使用。
Oracle 数据库的聚簇技术 61 数据库、服务名、实例 63 Oracle内存结构 64 sys用户和system用户 67 Oracle SQL语句 67 GROUPING SETS分组 74 Oracle外部程序触发 75 Oracle数据库的备份与恢复 77 Oracle分区功能提高...
Oracle_Index 索引
在《数据库原理》里面,对聚簇索引的解释是:聚簇索引的顺序就是数据的物理存储顺序,而对非聚簇索引的解释是:索引顺序与数据物理排列顺序无关。正式因为如此,所以一个表最多只能有一个聚簇索引。 不过这个定义太...
NULL 博文链接:https://dolphin-ygj.iteye.com/blog/444147
Oracle在线建立超大表的索引,为在线生产系统某核心大表建立索引
oracle 用户 全部 索引 all index sql
oracle索引,常见索引问题,详见PPT内容
oracle索引与分区索引介绍 删除分区 分区合并(从中间删除掉一个分区,或者两个分区需要合并后减少分区数量) 创建新的分区 交换分区
虽然存储介质和数据处理技术的发展也很快,但是仍然不能满足用户的需求,为了使用户的大量的数据在读写操作和查询中速度更快,Oracle提供了对表和索引进行分区的技术,以改善大型应用系统的性能。
删除索引 drop index CUS_LOWER_ENERGY_JLDNY; 新建一个索引 create index CUS_LOWER_ENERGY_JLDNY on CUS_LOWER_ENERGY (JLDBH, DLNY,HWBZ) tablespace TS_DSM_INDEX pctfree 10 initrans 2 maxtrans 255 ...
基于功能的Oracle索引使得数据库管理人员有可能 在数据表的行上过度分配索引。...Oracle9i有一个工具能够让你使用ALTER INDEX命令监视索引的使用。然后你可以查找这些没有使用的索引并从数据库里删除它们。
BLOG_Oracle之不可见索引.pdfBLOG_Oracle之不可见索引.pdfBLOG_Oracle之不可见索引.pdf
Oracle学习笔记(索引),有具体的代码案例,创建索引,删除索引,重建索引等等
oracle在线创建索引和重组索引。
oracle不走索引可能原因
oracle rac环境下索引热块的处理思路oracle rac环境下索引热块的处理思路
1.索引的创建与使用 2.创建索引的原则 3.索引的分类 4.创建索引的多种方法 5.管理索引 6.索引优化 7.查看、修改索引属性 8.修改索引名 9.删除索引
ORACLE 分区表 分区索引 索引分区 实例讲解
oracle的索引学习,oracle的索引学习,oracle的索引学习